Dashboard
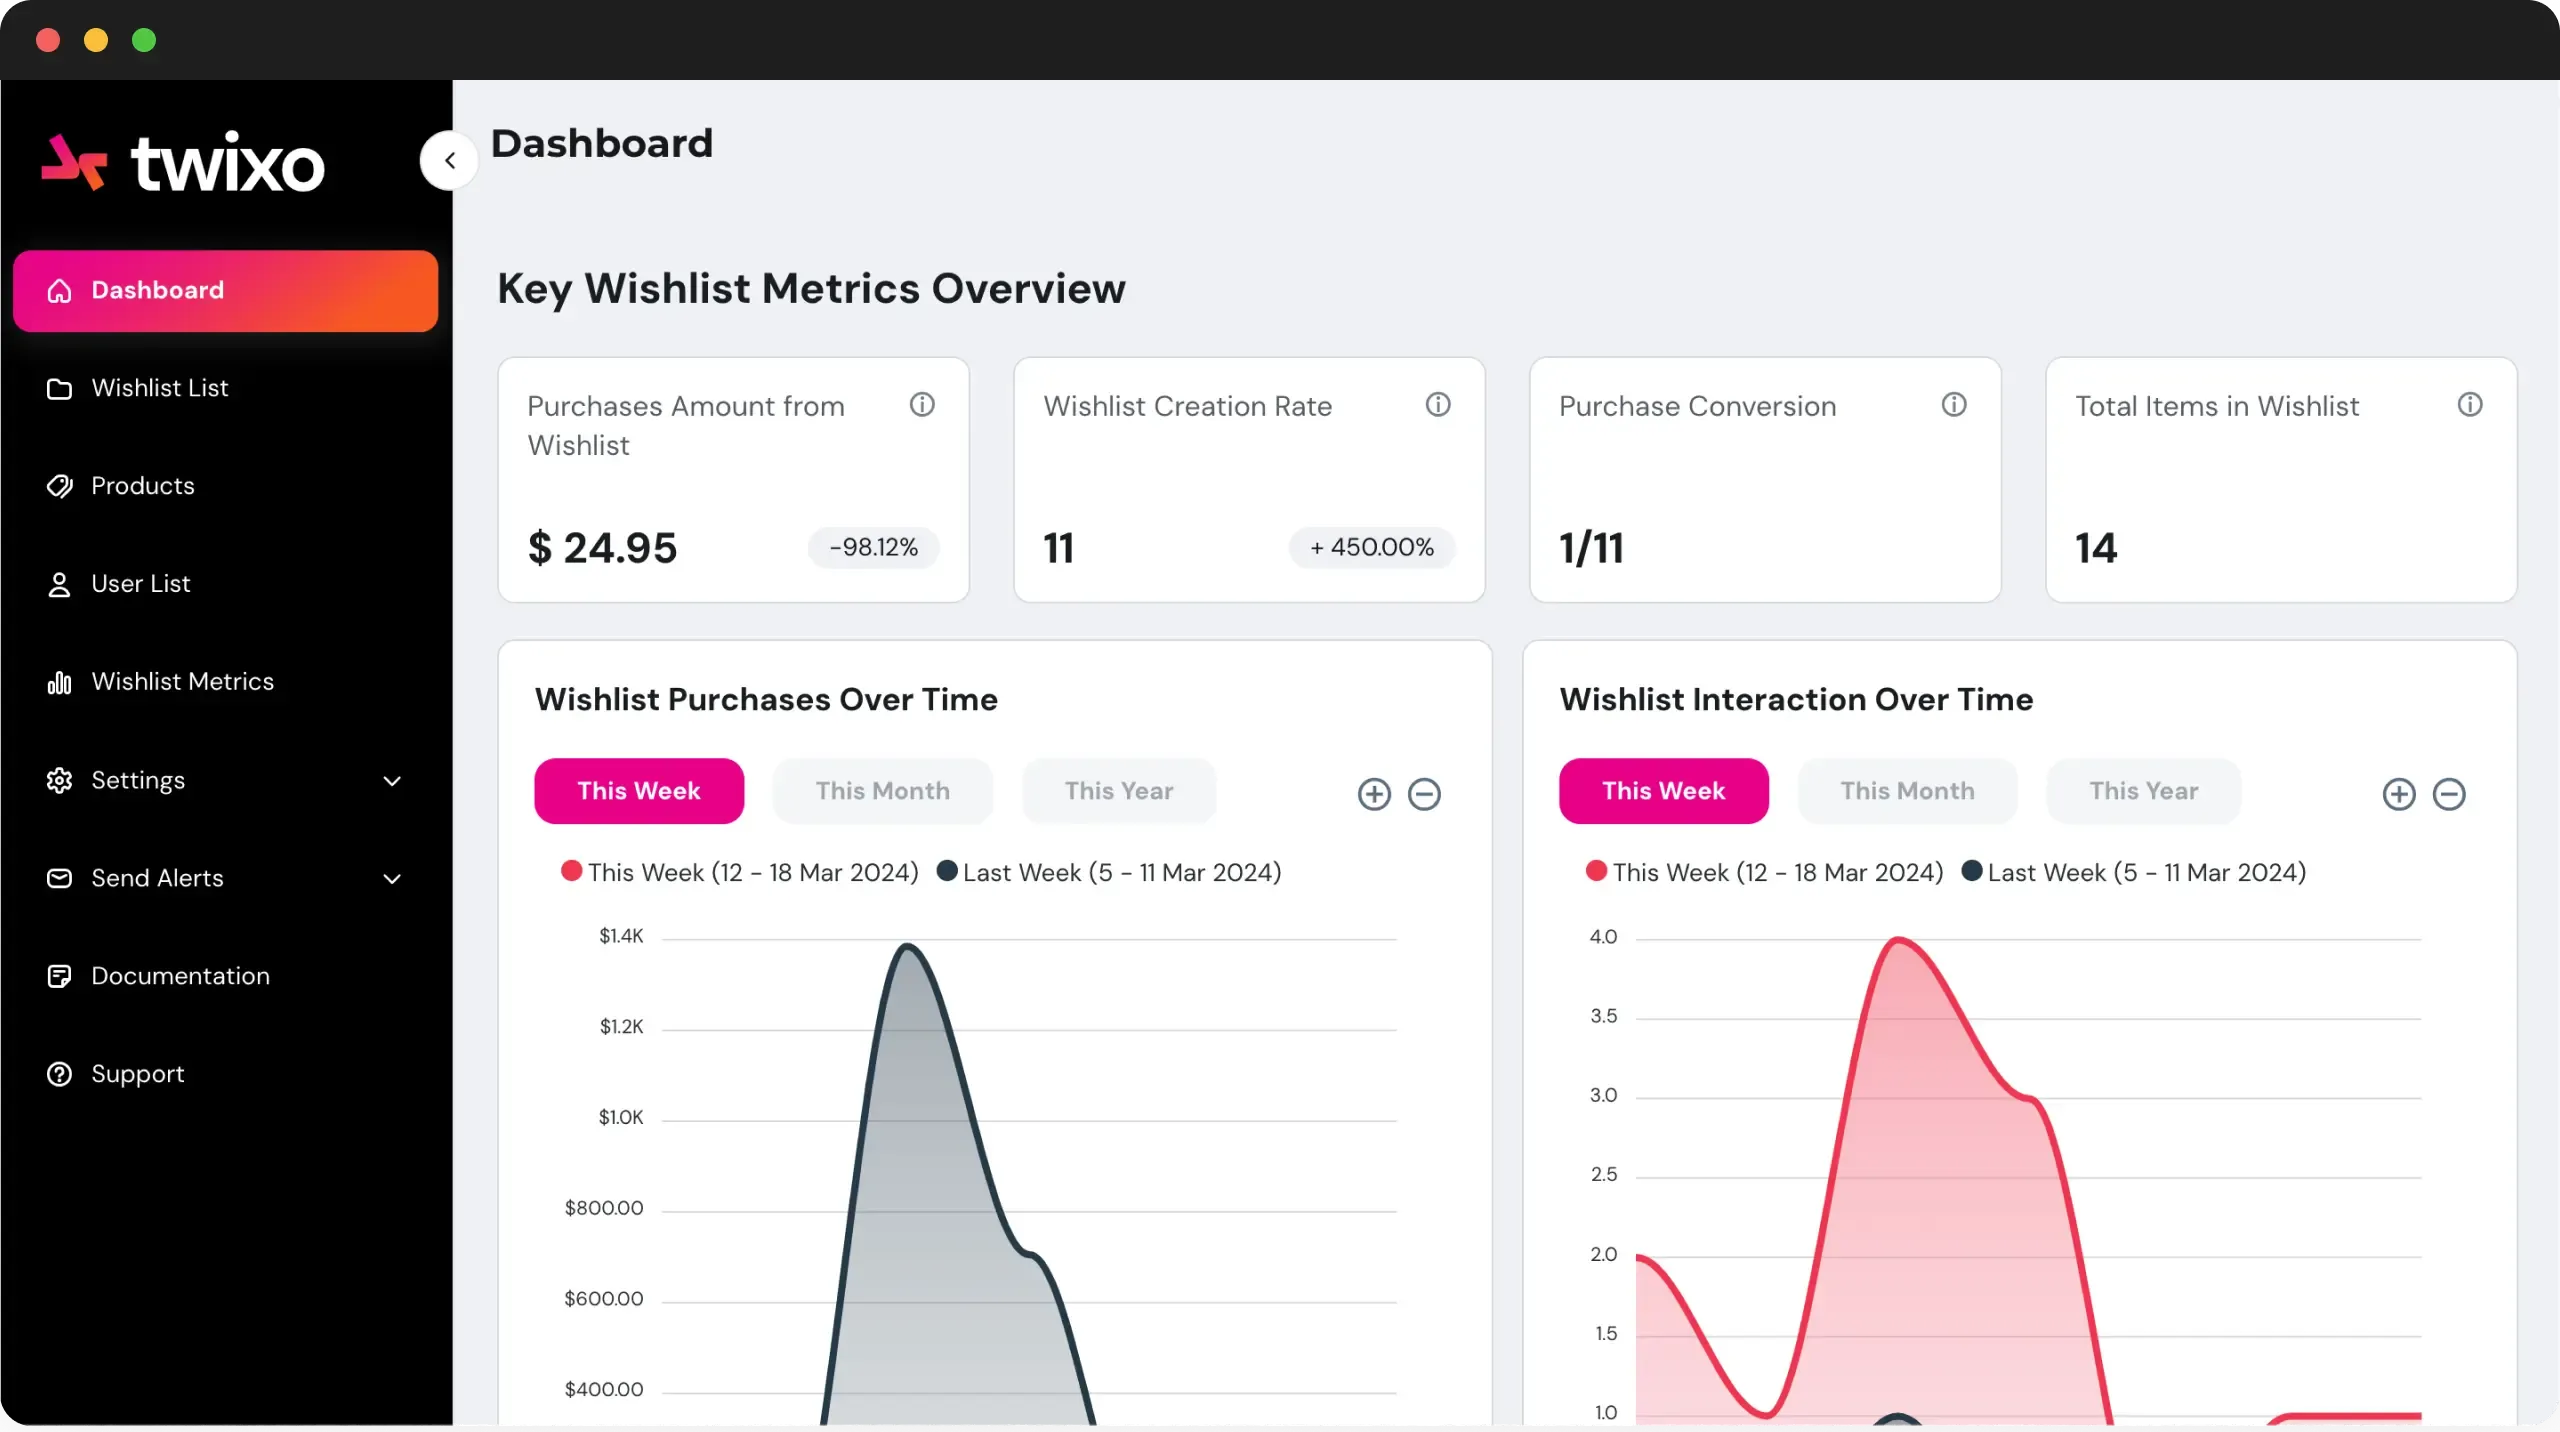
Your key wishlist metrics will be shown here for ease of access to the information you want. The dashboard offers insights into:
Purchases amount from your wishlist
- Total amount of purchases made from customers through the wishlist section.
- Evaluate the conversion rates of your products that are being sold from the wishlist addition.
Wishlist creation rate
- Total number of wishlists created on your store in relation to each customer visit.
- Comparing the rate within a specific time period identifies to outline the increments and decrements of wishlist creation.
Purchase conversion rates
- Total number of purchases made from consumer wishlist in relation to how many was created.
Total number of items in the customer’s wishlist
- Showcases the total number of items are in the consumer’s wishlist.
Wishlist purchases and interactions over a set period of time
- Insight into consumer engagement with the wishlist and how many products are selected and purchased.
Top wishlist items
- View your most added products by consumers into their wishlists to understand and make more informed business decisions - whether it is for inventory management, pricing, or customer demands.
Most active wishlist customers
- See your most active consumers who are interacting with the wishlist and what products have been added.
The dashboard also alerts you of the task at hand the upcoming week, month for your business. With these features highlighted in the front page, you can make calculated decisions and analysis for your next steps.